Connect in two minutes
Shibui Finance is a Claude integration. Choose your Claude plan below to get started — no config files, no CLI commands.
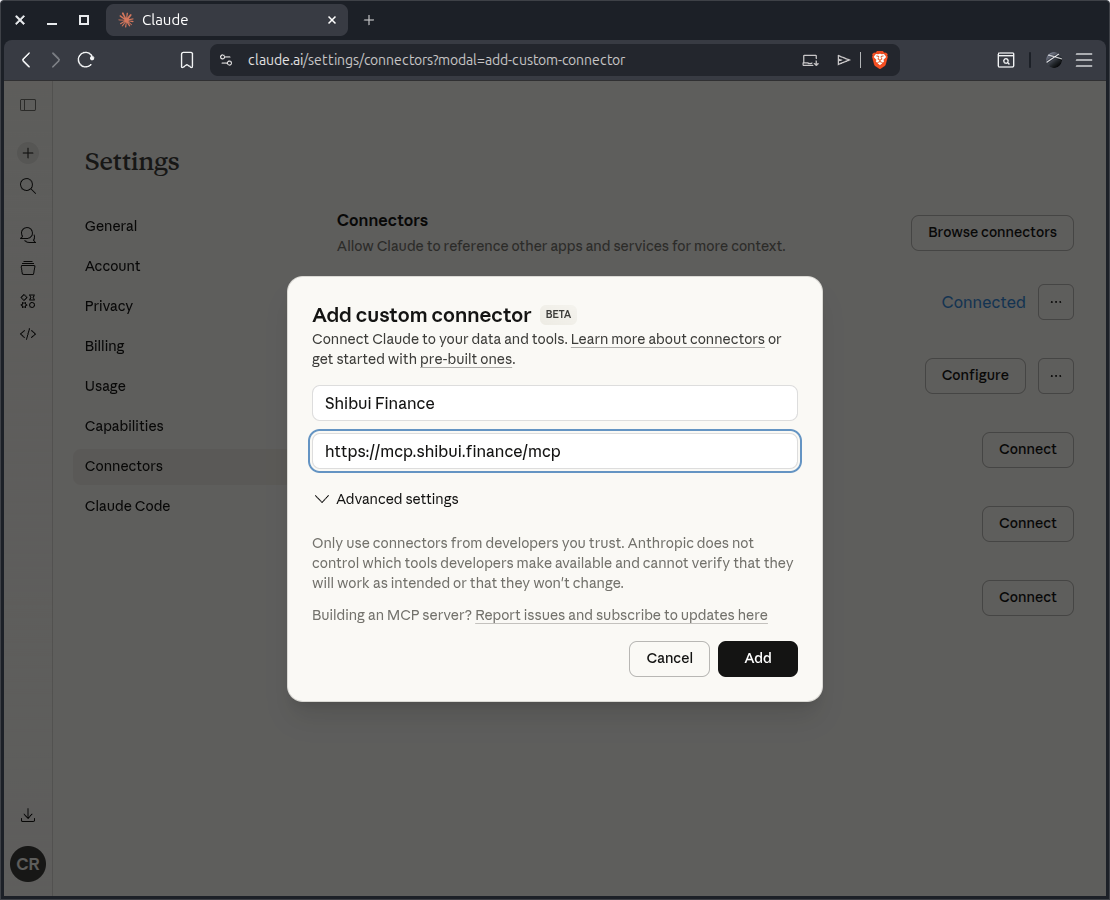
https://mcp.shibui.finance/mcp
Click your avatar, go to Settings, then select the Connectors tab.
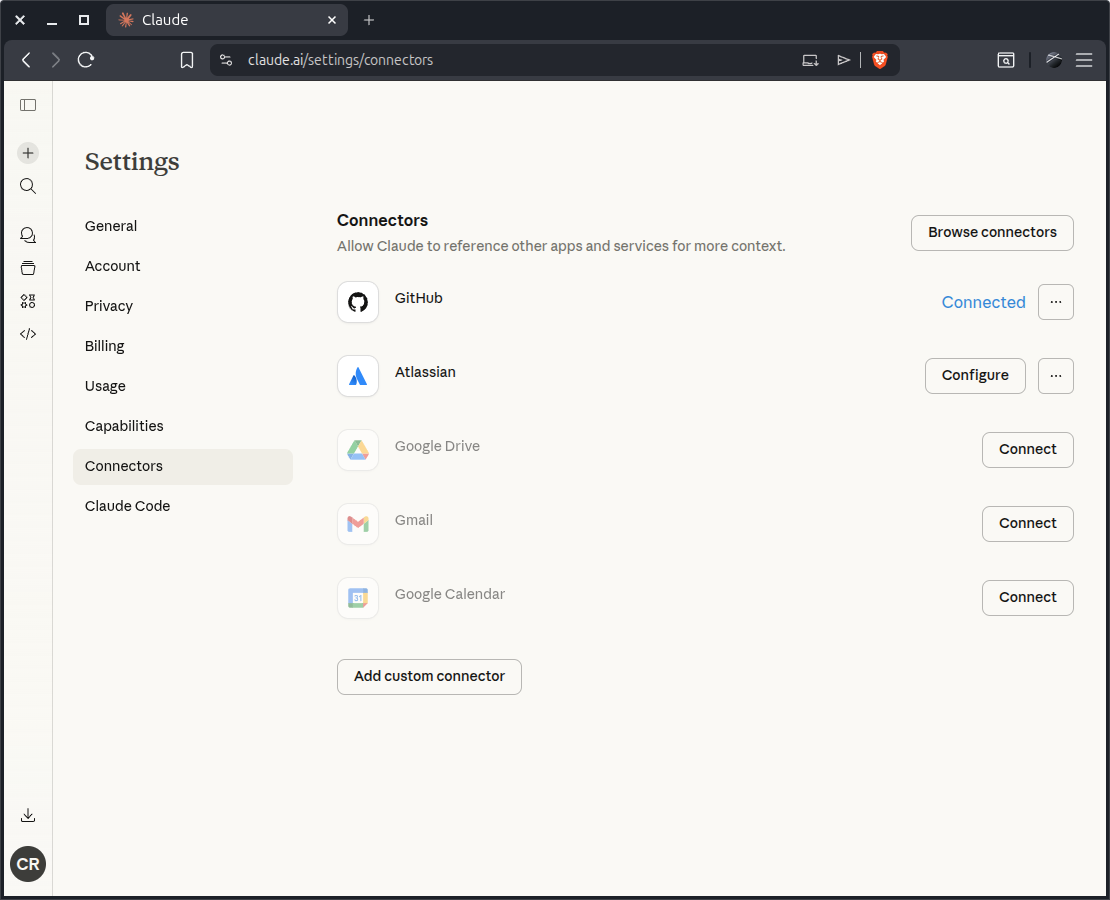
Click Add custom connector, enter a name, and paste the URL above.
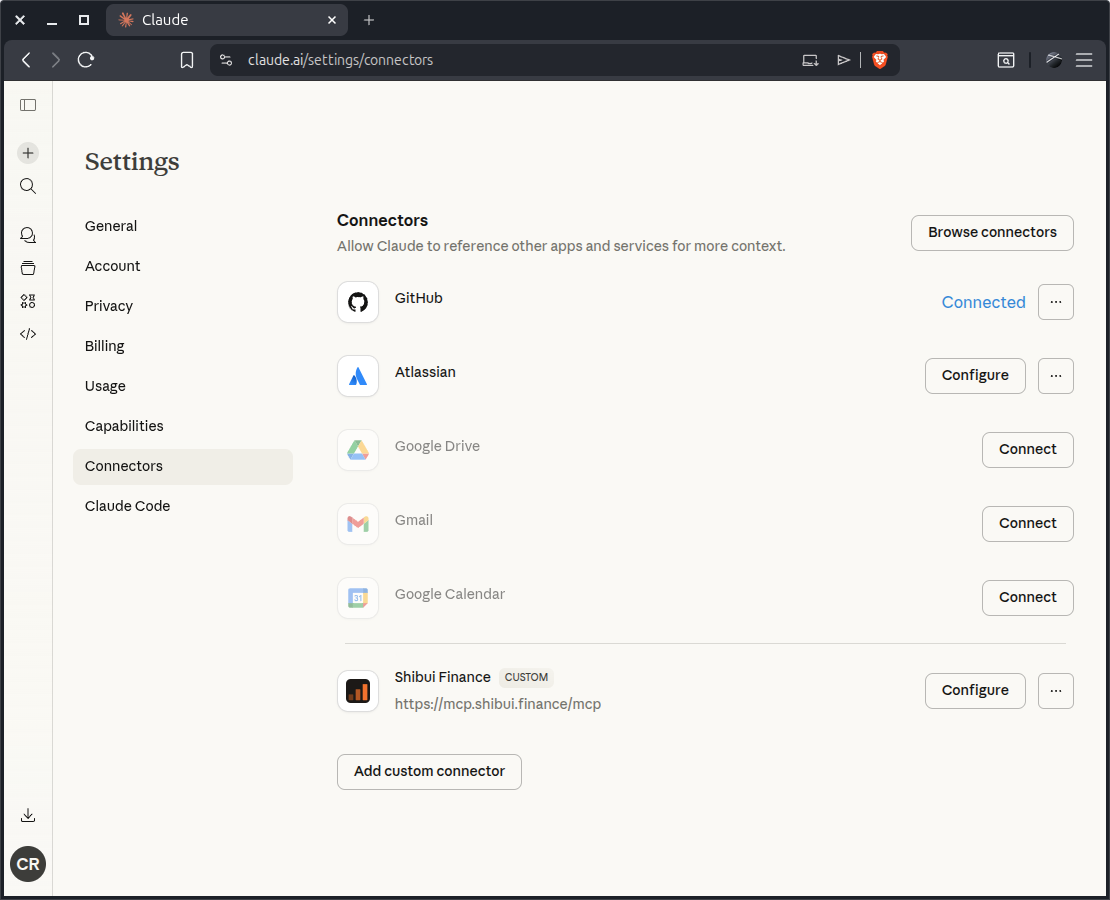
Shibui Finance appears in your connectors list and is available in every new conversation.
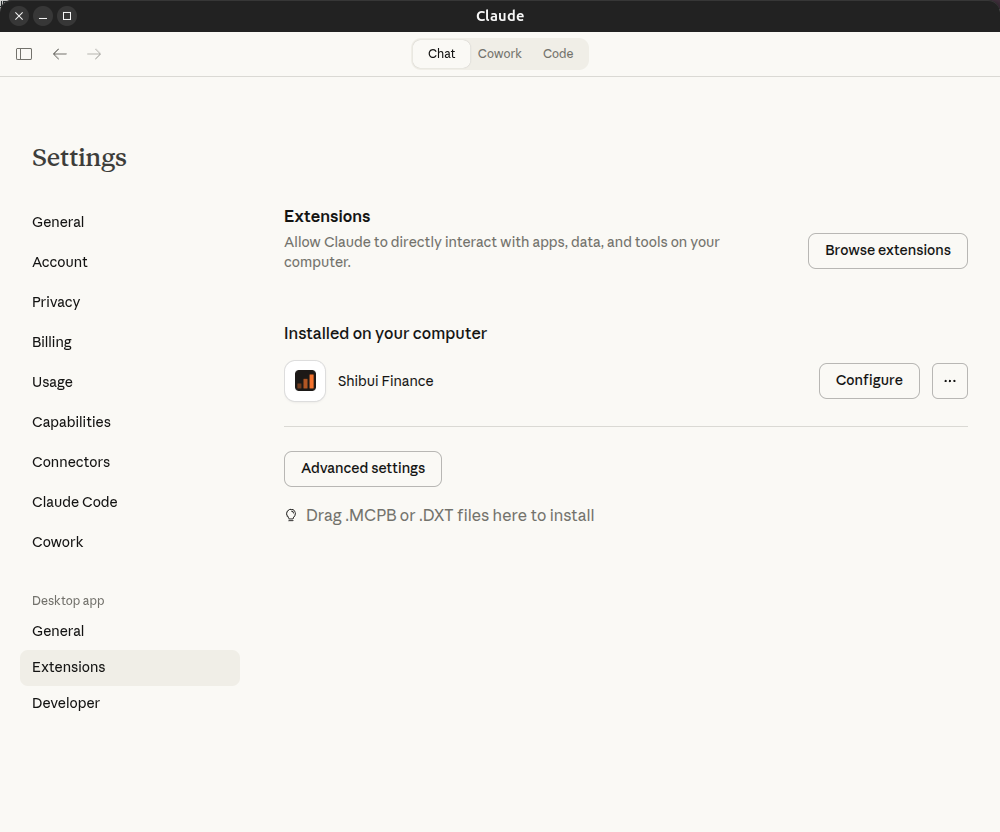
In Claude Desktop, go to Settings → Desktop app → Extensions.
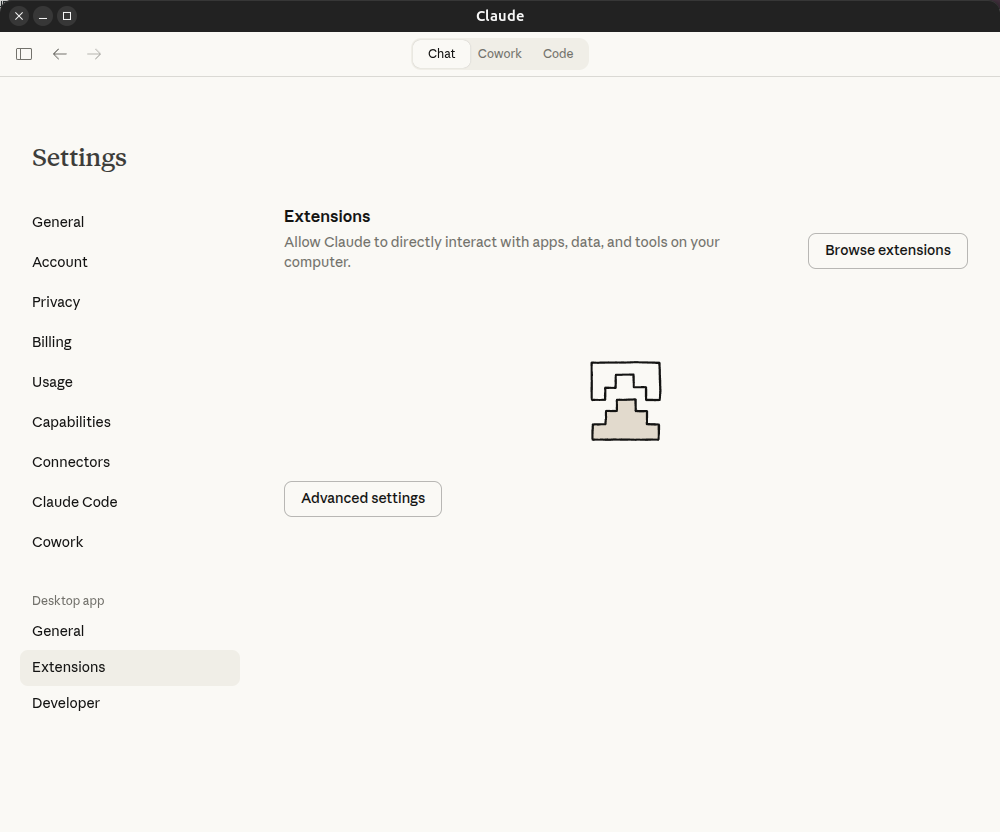
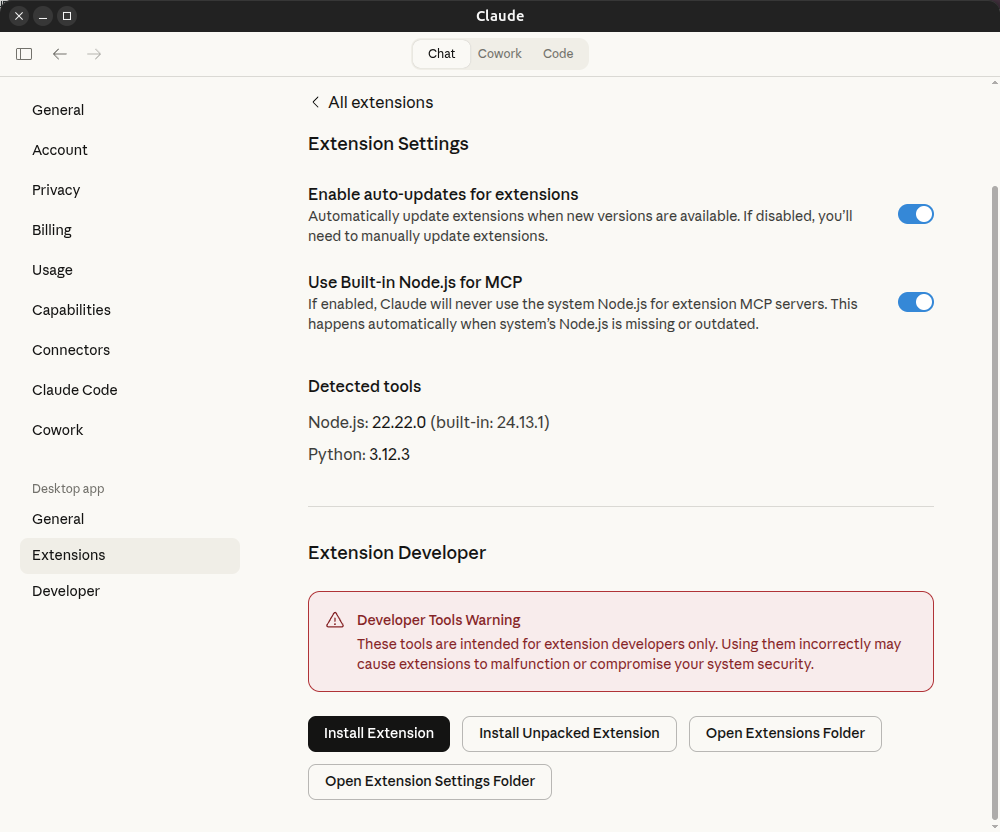
Click Advanced settings → Install Extension, then select the downloaded file.
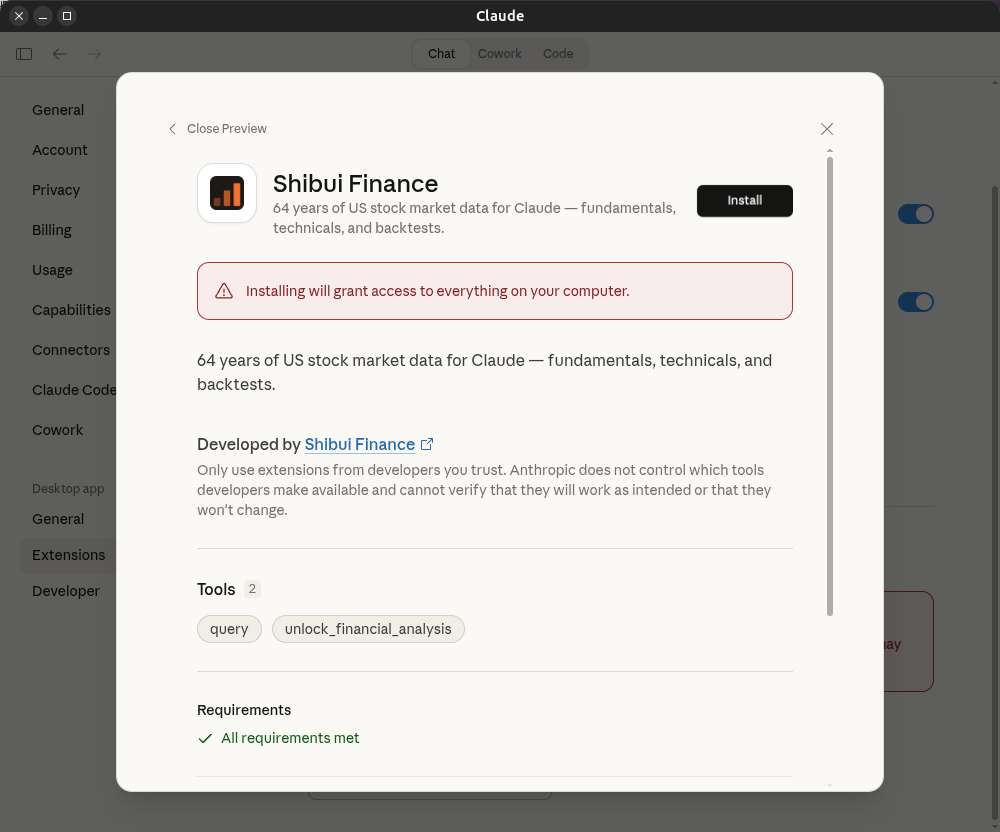
Review the extension details and click Install to confirm.
Shibui Finance appears in your extensions list and is available in every conversation.